(Grid)Survey#
Learn how to create a generic survey that observes anywhere in the sky.
Survey and GridSurvey are objects containing a footprint (imprint of the camera on the sky) and an observing strategy (where did you pointed the telescope with which filter etc.).
The main difference is that GridSurvey has a set of pre-defined fields, while Survey has not.
Survey: footprint and pointings#
Let’s start with the most generic survey. It needs:
data: an observing strategy (ra, dec, mjd, band, zp, skynoise etc…)footprint: the camera footprint in the sky (in degree)
1. Define the footprint#
For this example, let’s use a simple 1 degree-radius camera footprint.
The footprint in skysurvey is based on shapely
from shapely import geometry
footprint = geometry.Point(0,0).buffer(1)
footprint

2. Define the observing strategy#
Say we will do 10_000 pointings:
ra = [200,300]anddec =[-20,10].gain: will be 1skynoise: between 150 ± 20zp: 30mjd: between march 2020 and april 2020band: will be desg, desr or desi
skysurvey data are based on pandas.DataFrame (you can provide dict, this will be converted though)
import pandas
import numpy as np
from skysurvey.tools import utils
from astropy.time import Time
size = 10_000
data = {}
rng = np.random.default_rng()
ra, dec = utils.random_radec(size=size, ra_range=[200,250], dec_range=[-20,10])
data["ra"] = ra
data["dec"] = dec
data["gain"] = 1
data["zp"] = 30
data["skynoise"] = rng.normal(size=size, loc=150, scale=20)
data["mjd"] = rng.uniform(Time("2020-03-01").mjd, Time("2020-04-01").mjd, size=size)
data["band"] = rng.choice(["desg","desr","desi"], size=size)

data = pandas.DataFrame.from_dict(data)
data.head()
| ra | dec | gain | zp | skynoise | mjd | band | |
|---|---|---|---|---|---|---|---|
| 0 | 203.734215 | -10.845189 | 1 | 30 | 134.604820 | 58926.019592 | desi |
| 1 | 245.608116 | 7.143275 | 1 | 30 | 149.793298 | 58914.001713 | desi |
| 2 | 248.921343 | -3.617716 | 1 | 30 | 126.446520 | 58912.497486 | desr |
| 3 | 215.681984 | 9.748426 | 1 | 30 | 157.865103 | 58914.286535 | desi |
| 4 | 240.525379 | 5.598356 | 1 | 30 | 157.504097 | 58937.500915 | desg |
load a Survey from_pointings()#
import skysurvey
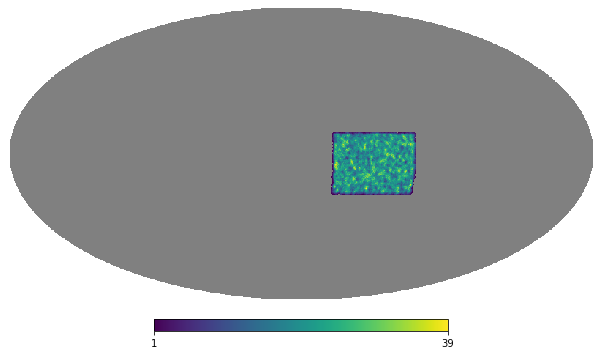
survey = skysurvey.Survey.from_pointings(data, footprint=footprint)
survey.show()
DataFrame Based#
survey.data (like any other skysurvey element) is a pandas.dataframe, so flexible and fast
survey.data # Show the data generated. time, band sky noise, gain, zp and fieldid.
| ra | dec | gain | zp | skynoise | mjd | band | fieldid_survey | fieldid | |
|---|---|---|---|---|---|---|---|---|---|
| 0 | 238.967056 | 9.991489 | 1 | 30 | 134.854340 | 58909.968750 | desi | 7578 | 194669 |
| 1 | 232.702621 | 9.993823 | 1 | 30 | 156.067108 | 58925.039062 | desg | 8678 | 194683 |
| 2 | 223.834122 | 9.989252 | 1 | 30 | 100.794708 | 58929.546875 | desr | 2700 | 194702 |
| 3 | 223.834122 | 9.989252 | 1 | 30 | 100.794708 | 58929.546875 | desr | 2700 | 194703 |
| 4 | 213.658463 | 9.985991 | 1 | 30 | 154.274536 | 58934.253906 | desg | 686 | 194725 |
| ... | ... | ... | ... | ... | ... | ... | ... | ... | ... |
| 364899 | 208.816757 | -19.948879 | 1 | 30 | 136.481613 | 58912.476562 | desi | 7295 | 325936 |
| 364900 | 208.087814 | -19.954334 | 1 | 30 | 151.730865 | 58930.867188 | desr | 2002 | 325937 |
| 364901 | 208.087814 | -19.954334 | 1 | 30 | 151.730865 | 58930.867188 | desr | 2002 | 325938 |
| 364902 | 205.706207 | -19.942360 | 1 | 30 | 140.218582 | 58918.582031 | desi | 2120 | 325943 |
| 364903 | 205.317245 | -19.938751 | 1 | 30 | 157.663254 | 58935.652344 | desg | 2587 | 325944 |
364904 rows × 9 columns
Survey is based on healpix#
For Survey has no pre-defined fields, the sky is based on healpy. When you load the instance, skysurvey computes which healpix pixel has been observed. By default, healpix’s nside is 200 (so a pixel is 0.08 deg^2 ; see survey.get_field_area()) ; nside is a Survey loading option.
# "field" surface in square degree. field here corresponds to a healpix pixel.
survey.get_field_area()
0.08594366926962348
info: fieldids and fieldids_survey#
fieldid: unit of sky area, in Survey, that is healpix based, this corresponds to a healpix pixel.
fieldid_survey: This is the fieldid corresponding to the initial pointing strategy you input (ra, dec).
Depending on you healpix resolution, you are likely to have many fieldid (healpix pixel) per fieldid_survey (footprint at the given RA, Dec). In that example, approximately 36. This makes sense since the camera has a “π deg^2” footprint, and the pixel area is 0.086 (pi/0.086 = 36.5)
survey.data.groupby("fieldid_survey")["fieldid"].nunique()
fieldid_survey
0       35
1       37
2       38
3       36
4       35
        ..
9995    37
9996    38
9997    35
9998    35
9999    38
Name: fieldid, Length: 10000, dtype: int64
survey.get_fieldstat("size")
fieldid
194669    1
194683    1
194702    1
194703    1
194725    2
         ..
325936    1
325937    1
325938    1
325943    1
325944    1
Length: 18724, dtype: int64
Matching coordinate with fields#
This is an important feature that enable us to know whic field contains which target
survey.radec_to_fieldid([26, 70])
| fieldid | |
|---|---|
| index_radec | |
| 0 | 14425 |
import numpy as np
# remark that, doing that this way, it won't be homogeneous.
rng = np.random.default_rng()
ra_flat = rng.uniform(0, 190, 200)
dec_flat = rng.uniform(-30, 90, 200)
survey.radec_to_fieldid([ra_flat,dec_flat])
| fieldid | |
|---|---|
| index_radec | |
| 0 | 266365 |
| 1 | 93470 |
| 2 | 46642 |
| 3 | 339675 |
| 4 | 206306 |
| ... | ... |
| 195 | 329987 |
| 196 | 282906 |
| 197 | 67 |
| 198 | 167187 |
| 199 | 56958 |
200 rows × 1 columns
GridSurvey: field, footprint and pointings#
Some surveys are observing pre-defined fields. That is the case for ZTF, that follows grid systems, or deep-fields surveys such as DES ou LSST.
A specific version of Survey, GridSurvey has been implemented for a more realistic user experience and to avoid healpix pixel approximation ; GridSurvey is also slight faster. To associate coordinates to fields GridSurvey is based on shapely and geopandas only (see skysurvey.survey.PolygonSurvey for details) ; no need for healpy
Deep-Field Survey#
let’s use as an example two deep field surveys:
“cosmos”: ‘ra’:+150.11916667, ‘dec’:+2.20583333,
“xmm-lss”: ‘ra’:+35.7083333 ,’dec’:-4.749999
and let’s use a 8 degree size, square camera footprint
from shapely import geometry
fields = {"cosmos": {'ra':+150.11916667, 'dec':+2.20583333},
          "xmm-lss": {'ra':+35.7083333 ,'dec':-4.749999}
         }

vertices_camera = np.asarray([[-0.5,-0.5],[0.5,-0.5], [0.5,0.5],[-0.5,0.5]]) * 8
footprint = geometry.Polygon(vertices_camera)
footprint

Define observation#
Your observation should now not contain RA, Dec (this will be ignored), but a fieldid. Hence, using the very same example as above, but say we observed 10x more the cosmos field
size = 10_000
data = {}
rng = np.random.default_rng()

# Data
data["fieldid"] = rng.choice(["cosmos","xmm-lss"],
                             size=size,
                             p=np.asarray([10, 1])/11) # 10x 'cosmos' for 1x 'xmm-lss'
data["gain"] = 1
data["zp"] = 30
data["skynoise"] = rng.normal(loc=150, scale=20, size=size)
data["mjd"] = rng.uniform(Time("2020-03-01").mjd, Time("2020-04-01").mjd, size=size)
data["band"] = rng.choice(["desg","desr","desi"], size=size)

data = pandas.DataFrame.from_dict(data)
data.head()
| fieldid | gain | zp | skynoise | mjd | band | |
|---|---|---|---|---|---|---|
| 0 | cosmos | 1 | 30 | 162.607595 | 58926.711832 | desg |
| 1 | xmm-lss | 1 | 30 | 183.266174 | 58939.027724 | desr |
| 2 | xmm-lss | 1 | 30 | 147.466105 | 58928.758544 | desr |
| 3 | cosmos | 1 | 30 | 165.267523 | 58926.307188 | desg |
| 4 | xmm-lss | 1 | 30 | 142.666700 | 58916.393582 | desr |
from skysurvey.survey import GridSurvey
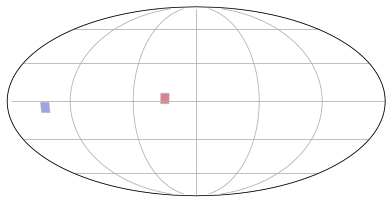
gsurvey = GridSurvey.from_pointings(data, fields, footprint)
fig = gsurvey.show(vmin=0, vmax=10, cmap="coolwarm")
Predefined Survey#
ZTF(GridSurvey)DES(GridSurvey) | deep-fieldsLSST(GridSurvey) | deep-fields (see “Load the LSST survey)